Since I temporarily can't deliver, at least let's make some promises. Every politician knows they usually work very well, fulfilled or not (mostly the latter).
Order of listing is arbitrary.
Oncology:
1. Assessment and mitigation of cancer risk over the lifetime. Incidence, mortality and survival of various cancers nowadays and in the past for various age groups. Potential methods of their early detection, at least for some of them. Trends in incidence and survival in the last 30 years of medical development. Other life-threading hazards.
2. Discussion of difficulties in diagnosing early melanomas (most dangerous type of skin cancer) with some fail-safe precaution approach.
IT:
1. A glance at the market situation in terms of Microsoft vs the world of open source battle. Possible future outcome.
2. Some generic thoughts about social networks including picking up the idea, key implementation aspects and further portal development. Some retrospectives to most popular Polish web 2.0 site nasza-klasa.pl.
Automotive:
1. How to buy a very safe car - combining crash test results with medical losses by make and model as well as some other aspects of choosing a vehicle offering most protection. Visualisation about how suitable (or not) modern crash tests are.
2. Ford Motor Company as an example of serious strategy flaws in motoring business.
3. Plug-in hybrids and where they belong. Options of sustainable motoring and potential issues. Maybe a cool and handy calculator will come in place.
4. Which types of vehicles (breakdown by classes and fuel types) are driven hence pollute most? In the search of Jevons paradox, some handy findings were discovered.
5. Bias in German motoring press.
6. A rant about the best sports car in the world.
7. Petrol engines that beat their diesel counterparts.
8. Car industry in numbers.
9. Battle of all wheel drives - quattro vs xdrive vs haldex vs 4matic - torque based vs skid detection based. A proof of the concept that only AWD cars should be made.
10. Hybrids vs diesels rematch since new players have come into field.
11. Samples of rather obvious designs and product planning faults, including Lexus and Honda.
12. A rant about some cars from VW AG that are finally thrilling.
13. Polish translation of one of the best guides to defensive driving I have ever come across.
14. A word about fuel/energy efficiency of various means of transport. Do we really save much by taking a bus? Share of various means of energy consumption of a household.
15. Formula 1, what matters there. A car or a driver?
Simple yet effective peak oil mitigation:
1. Guidelines how to buy a proper city bicycle. Forget once and for all about pointless traffic jams.
2. Seriously professional advice how to cut you fuel consumption four-fold.
Relax:
1. Music this good you'll hardly believe your ears.
When will it appear?
Dunno, mate! At some point! It'll take at least a week from now to start. But at least now I have some way to memorize ideas.
Sunday 26 October 2008
Friday 17 October 2008
He knows what a car is for
I'm preparing the next three, hopefully interesting articles about motoring but these take more time than expected, a resource I'm currently short of. People usually are short of it these days which I consider one of the major flaws of life, if you ask me, as it often means they focus on petty little irrelevant details instead of on things that matter.
So for the sake of continuum, I'd like to share a brilliant find with you. I randomly encountered a bloke who really understands what a car is for.
It's not to commute and pollute, to put on 30 thousands miles per annum, to have an enormous boot and to be hugely practical, like a box with wheels attached to it. When we have plug-in hybrids charged with renewable electricity, it may serve such purpose.
But now a car is for something else and this chap knows it. Enjoy. Not only the understanding, but the quality and ingenuity of filming and editing too.
by Ambition Tube
Should you be interested in soundtracks, as second comes You and Your Hand by Pink and the third is Empty Streets by Late Night Alumni, possibly a version called "original mix".
Monday 6 October 2008
Quest for the quietest car
A good quality car is the one that cruises about as quietly as possible and isolates its passengers from noise, vibrations and harshness of the ride. Shouting? Growling? When you put your foot down, yes, it may be desired by some. But for another 99% of the time you want it to whisper, not to cause a headache.
All measurements are in decibels. While the decibel as a way of measuring intensity of noise is a complex term, it can be very easily demonstrated. There is an excellent webpage with flash animations presenting you noises decreasing by 3 or 1 or 0,3 decibels. Try it. This will allow you to see the differences between compared cars. It’s essential to realize that decibel is a logarithmic measure which means that relatively large changes in noise level result in little changes in decibels measured.
Then look at this chart to see what's what in terms of noises around us.
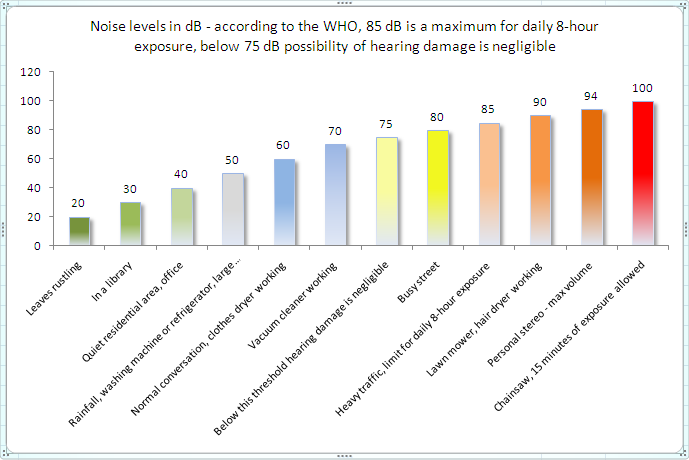
The list of cars has been ordered by the noise measured inside the car at 70 mpg (~112,5 km/h). If results were equal, a noise at full throttle was considered - the lower, the better. Source is Edmunds InsideLine full or comparison tests. To put V8 diesels in perspective, two additional cars: Audi A8 4.2 TDI and BMW 745d were measured by Auto Motor und Sport at 100 and 130 km/h. Measurements were then interpolated and floored (rounded down to the nearest integer).
The upper part of the list almost certainly contains the quietest cars on the market today. The lower may not be as representative. Some cars absent here may land somewhere between the ones measured and placed there.
A clear conclusion is that while the top is occupied by very expensive vehicles, it is by no means a necessity to spend a lot of money to get a really silent car.
In case of some cars like BMW 335i and Toyota Prius, more than one measurement was available. Lower results were picked in such cases as one can assume that readings in noise level measurement procedure can much easier be overstated (due to presence of additional noise sources like something outside the moving vehicle during the test) than understated. It's nearly impossible to unintentionally make test noise readings lower in a vehicle cruising at a given speed.
Format is: the rank, the car and noise level in decibels
at 70 mph (~112,5 km/h)
at full throttle
when idling
Late entries - after tidying up the post I realized Volvo XC90 wasn’t enrolled. So quick check places it as follows: the 2003 2.5 turbo is out of business with its 75 dB, the 2005 with Yamaha V8 (68 dB) is placed between Jaguar XF Supercharged and VW Passat 2.0 turbo and the 2007 V8 Sport performs very well and with it 64 dB and 84 dB (cruising and full throttle) lands somewhere after the BMW 745d.
References
2009 Acura TSX
2007 Acura RDX turbo
2005 Acura RL
Audi Q7 4.2
2009 Audi A4 3.2
Audi A8 W12 L
2006 Audi A6 4.2 Quattro S-Line
Audi S5
2007 Bentley Continental GT, 2007 Mercedes-Benz CL600
2003 Bentley Arnage R
Bentley Continental Flying Spur
2007 BMW X5 4.8i
2007 BMW X3, 2008 Land Rover LR2
BMW 335i Coupe
BMW 750i
2008 BMW 535i
2006 BMW 550i
2007 Jaguar XK 2006 BMW 650i
2007 BMW M6 2007 Mercedes-Benz SL65 AMG
2005 Cadillac STS
2007 Cadillac Escalade
2009 Hyundai Genesis V8
2009 Hyundai Genesis V6
2004 Infiniti QX56
2007 Infiniti G35 Sport, 2007 BMW 335i, 2008 Cadillac CTS, 2008 Lexus IS 350, 2008 Mercedes-Benz C350 Sport
2005 Jaguar Super V8
2009 Jaguar XF Supercharged
2006 Land Rover Range Rover Sport Supercharged
2006 Land Rover Range Rover Supercharged
2005 Land Rover LR3
Lexus LS 600h L
Lexus LS 460
Lexus GS 450h
Lexus GS 350
2007 Lexus ES 350
2007 Lincoln Navigator L 4WD
2007 Lincoln MKX
2007 Lincoln MKZ
2009 Lincoln MKS AWD
2006 Porsche Cayenne Turbo S
Rolls Royce Phantom
2008 Mercedes-Benz GL320 CDI
2006 Mercedes-Benz ML350
Mercedes-Benz S550
Mercedes-Benz E320 CDI Bluetec
Mercedes-Benz GL450
2009 Mazda 6, 2009 Mazda 6, 2008 Nissan Altima 3.5 SE
2008 Toyota Highlander Hybrid
2008 Toyota Camry Hybrid, 2008 Toyota Prius II
2009 Volkswagen Jetta TDI
2006 Volkswagen Passat 2.0T
2007 Volkswagen Passat Wagon 3.6 4Motion
Volkswagen Touareg 2 V8
Volkswagen Phaeton W12
2007 Volvo S80 V8 AWD
2007 Volvo XC90 V8 Sport
2005 Volvo XC90 V8
2003 Volvo XC90 2.5T
All measurements are in decibels. While the decibel as a way of measuring intensity of noise is a complex term, it can be very easily demonstrated. There is an excellent webpage with flash animations presenting you noises decreasing by 3 or 1 or 0,3 decibels. Try it. This will allow you to see the differences between compared cars. It’s essential to realize that decibel is a logarithmic measure which means that relatively large changes in noise level result in little changes in decibels measured.
Then look at this chart to see what's what in terms of noises around us.
The list of cars has been ordered by the noise measured inside the car at 70 mpg (~112,5 km/h). If results were equal, a noise at full throttle was considered - the lower, the better. Source is Edmunds InsideLine full or comparison tests. To put V8 diesels in perspective, two additional cars: Audi A8 4.2 TDI and BMW 745d were measured by Auto Motor und Sport at 100 and 130 km/h. Measurements were then interpolated and floored (rounded down to the nearest integer).
The upper part of the list almost certainly contains the quietest cars on the market today. The lower may not be as representative. Some cars absent here may land somewhere between the ones measured and placed there.
A clear conclusion is that while the top is occupied by very expensive vehicles, it is by no means a necessity to spend a lot of money to get a really silent car.
In case of some cars like BMW 335i and Toyota Prius, more than one measurement was available. Lower results were picked in such cases as one can assume that readings in noise level measurement procedure can much easier be overstated (due to presence of additional noise sources like something outside the moving vehicle during the test) than understated. It's nearly impossible to unintentionally make test noise readings lower in a vehicle cruising at a given speed.
Format is: the rank, the car and noise level in decibels
at 70 mph (~112,5 km/h)
at full throttle
when idling
 | 1. Lexus LS 600h L 58,9 66,6 38,3 Anything this Lexus does, it does it quieter than Rolls Royce Phantom. Not bad! The only car that can possibly beat the largest hybrid is the Maybach. Edmunds InsideLine did a full test of it and... they didn’t measure noise levels! 2. Rolls Royce Phantom 59,0 67,0 40,0 The Queen Elizabeth is where she's supposed to be - at the very top of the list. 3. 2008 BMW 535i 61,2 70,7 43,1 That's a true surprise, to see this Bimmer here. But when one thinks about it for a second, it becomes somewhat logical. The 535i has a twin-turbo petrol straight six. High torque due to charging means little revs are needed to cruise what decreases the noise. And then come the turbines themselves, clogging the exhaust manifold and quieting the car even more. Excellent performance from an unsuspected contender. 4. Mercedes-Benz S550 62,0 66,0 48,0 It was certain to find this car close to the top. 5. Lexus LS 460 62,5 68,3 37,2 LS460 follows its hybrid version closely. 6. 2007 BMW 335i 62,5 76,3 46,9 Like father, like son, the 335i twin-turbo handsome looking brute benefits from the same quietly beating yet potent heart. 7. Mercedes-Benz GL450 62,6 72,5 42,6 Big powerful SUV means there's lots of space and carrying capacity for decent sound insulation. Big V8 in low revs doesn't shout either. 8. 2005 Land Rover LR3 63,0 69,0 Low Softly-sprung LR3 is an oasis of comfort also in terms of noise level. 9. 2006 BMW 650i 63,1 71,5 45,0 A transcontinental grandtourer can growl a bit when floored but has to whisper when not. 10. 2009 Hyundai Genesis V8 63,3 72,3 43,8 Can you recall all those people mocking Korean cars and disrespecting these as cheap and nasty econo-boxes? 11.2009 Hyundai Genesis V6 63,5 70,8 39,6 12. 2007 BMW X5 4,8i 63,6 77,6 46,0 13. BMW 750i 64,0 69,0 45,0 14. 2007 Mercedes-Benz CL600 64,0 70,5 43,0 Jeremy Clarkson calls this car "the new King of the Road" 15. 2006 Land Rover Range Rover Supercharged 64,0 72,0 Low Louder than the LR3. 16. 2009 Audi A4 3,2 V6 64,0 72,8 43,5 Handsome looks, front axle shifted forward, rear-biased quattro, small petrol engines all fitted with turbochargers - very good. And now it turns out the B8 A4 is also very quiet. 17. BMW 745d 64,0 unknown unknown 18. 2007 Jaguar XK 64,2 77,2 45,5 19. 2007 BMW X3 64,2 71,8 40,5 Very quiet for a not that expensive compact SUV. 20. 2007 Lincoln MKX 64,3 72,6 48,4 Same can be said about this Lincoln. 21. 2007 Mercedes-Benz E550 64,4 70,8 45,9 22. 2007 Lincoln MKZ 64,5 73,2 46,9 23. 2009 Lincoln MKS AWD 64,6 74,5 44,0 24. Volkswagen Touareg 2 V8 64,7 71,6 42,6 25. Lexus GS 350 64,7 72,2 39,2 26. 2006 BMW 550i 64,8 69,4 42,7 27. Mercedes-Benz E320 CDI Bluetec 65,0 68,8 45,5 28. 2006 Mercedes-Benz ML350 65,0 69,0 41,0 29. 2008 Toyota Highlander Hybrid 65,0 69,6 42,4 Decent result - the Highlander Hybrid makes sense not only in terms of fuel economy but also the quiet ride. 30. Bentley Continental Flying Spur 65,0 73,0 46,0 You'd expect the big Bentley to fare better, wouldn't you. 31. 2008 Mercedes-Benz C350 Sport 65,2 75,8 43,3 32. 2008 Land Rover LR2 65,3 74,5 42,3 33. 2007 Bentley Continental GT 65,5 72,4 50,4 34. 2007 Volvo S80 V8 AWD 65,5 79,6 44,5 35. 2006 Audi A6 4,2 Quattro S-Line 65,6 70,4 47,5 36. 2007 Mercedes-Benz GL320 CDI 65,8 71,3 46,1 37. 2007 Lincoln Navigator L 4WD 65,8 75,0 42,3 38. Audi A8 4.2 TDI 66,0 unknown unknown Not as refined as its petrol rivals. 39. 2009 Acura TSX 66,1 74,9 41,8 40. 2008 Nissan Altima 3.5 SE 66,2 73,6 41,7 41. 2007 Mercedes-Benz SL65 AMG 66,3 74,0 47,7 SL can be excused by its retractable hardtop, one of the best inventions in car body design. 42. 2008 Toyota Camry Hybrid 66,7 73,1 46,8 (engine on) 42,4 (engine off) Good result for a relatively inexpensive car the Camry Hybrid is, to see it among much more pricey vehicles. 43. 2006 Porsche Cayenne Turbo S 66,8 73,8 42,4 44. 2007 BMW M6 66,8 77,7 58,0 45. 2007 Infiniti G35 Sport 66,9 77,6 41,4 46. 2006 Land Rover Range Rover Sport Supercharged 67,0 69,0 48,0 47. Lexus GS 450h 67,0 73,6 37,5 Disappointing. Its petrol counterpart is much higher in the rank. 48. Audi A8 W12 L 67,0 75,6 44,5 Is it really the ultimate luxury sedan from Audi, so low in the rank? 49. 2007 Cadillac Escalade 67,1 78,4 44,8 Quieter than rap music its stereo plays all the time. 50. 2009 Mazda 6 67,1 80,1 44,1 Mazda 6 fares well in quietness department also. 51. 2008 Honda Accord EX-L 67,3 73,1 44,7 52. 2005 Jaguar Super V8 67,5 73,6 48,0 53. 2007 Lexus ES 350 67,5 74,6 41,0 54. 2008 Cadillac CTS 67,5 82,9 43,3 55. 2008 Toyota Prius II 67,7 70,6 47,2 (engine on) 40,7 (engine off) The lightweight hybrid has no chance of having thick sound proofing, still performs well, most likely thanks to CVT gearbox which can adjust engine revs as precisely as needed and low drag decreasing wind noise. 56. 2009 Jaguar XF Supercharged 67,8 72,5 46,8 In the past, big cats used to tiptoe when moving about. 57. 2006 Volkswagen Passat 2.0T 68,3 71,2 45,8 This is a turbocharged car so same principles as in case of twin-turbo bimmers should work also. They don't. Little sound insulation? 58. Audi S5 68,8 77,2 42,5 The handsome S5 was born to growl so its poor performance can be somewhat excused. 59. 2007 Volkswagen Passat Wagon 3.6 4Motion 68,9 73,3 44,0 60. 2008 Lexus IS 350 68,9 77,9 38,6 Loud. 61. 2005 Acura RL 69,0 71,0 unknown Lots of good things can be heard about Acuras so I was expecting these to fare much better. 62. 2007 Acura RDX turbo 69,4 75,2 41,4 63. Audi Q7 4,2 69,8 74,1 45,0 After achieving scary fuel economy of 11,2 MPG in Edmunds InsideLine full test, the big Audi finds itself quite low in this rank too. The Merc GL450 achieves 15 MPG and is at the opposite end of the list. 64. 2009 Volkswagen Jetta TDI 70,0 72,8 47,7 Very good for a small diesel sedan. The common rail injection smoothers the rattle. Typical for a diesel, high low-end torque allows the car to cruise at low revs and helps too. 65. 2005 Cadillac STS 70,0 73,0 unknown 66. Volkswagen Phaeton W12 70,0 73,0 unknown As the fifteenth child of dr Ferdinand Piëch (yes, he really has 13 children, the 14th is the Bugatti Veyron) this car cries rather loud as for an ultimate VW sedan. 67. 2004 Infiniti QX56 70,0 75,0 unknown 68. 2003 Bentley Arnage R 73,0 75,0 51,0 No comments. This car weight nearly 2600 kg (~5700 pounds), has an engine from a locomotive which barely has to rev to power the car along and yet it finishes last here. |
Late entries - after tidying up the post I realized Volvo XC90 wasn’t enrolled. So quick check places it as follows: the 2003 2.5 turbo is out of business with its 75 dB, the 2005 with Yamaha V8 (68 dB) is placed between Jaguar XF Supercharged and VW Passat 2.0 turbo and the 2007 V8 Sport performs very well and with it 64 dB and 84 dB (cruising and full throttle) lands somewhere after the BMW 745d.
References
2009 Acura TSX
2007 Acura RDX turbo
2005 Acura RL
Audi Q7 4.2
2009 Audi A4 3.2
Audi A8 W12 L
2006 Audi A6 4.2 Quattro S-Line
Audi S5
2007 Bentley Continental GT, 2007 Mercedes-Benz CL600
2003 Bentley Arnage R
Bentley Continental Flying Spur
2007 BMW X5 4.8i
2007 BMW X3, 2008 Land Rover LR2
BMW 335i Coupe
BMW 750i
2008 BMW 535i
2006 BMW 550i
2007 Jaguar XK 2006 BMW 650i
2007 BMW M6 2007 Mercedes-Benz SL65 AMG
2005 Cadillac STS
2007 Cadillac Escalade
2009 Hyundai Genesis V8
2009 Hyundai Genesis V6
2004 Infiniti QX56
2007 Infiniti G35 Sport, 2007 BMW 335i, 2008 Cadillac CTS, 2008 Lexus IS 350, 2008 Mercedes-Benz C350 Sport
2005 Jaguar Super V8
2009 Jaguar XF Supercharged
2006 Land Rover Range Rover Sport Supercharged
2006 Land Rover Range Rover Supercharged
2005 Land Rover LR3
Lexus LS 600h L
Lexus LS 460
Lexus GS 450h
Lexus GS 350
2007 Lexus ES 350
2007 Lincoln Navigator L 4WD
2007 Lincoln MKX
2007 Lincoln MKZ
2009 Lincoln MKS AWD
2006 Porsche Cayenne Turbo S
Rolls Royce Phantom
2008 Mercedes-Benz GL320 CDI
2006 Mercedes-Benz ML350
Mercedes-Benz S550
Mercedes-Benz E320 CDI Bluetec
Mercedes-Benz GL450
2009 Mazda 6, 2009 Mazda 6, 2008 Nissan Altima 3.5 SE
2008 Toyota Highlander Hybrid
2008 Toyota Camry Hybrid, 2008 Toyota Prius II
2009 Volkswagen Jetta TDI
2006 Volkswagen Passat 2.0T
2007 Volkswagen Passat Wagon 3.6 4Motion
Volkswagen Touareg 2 V8
Volkswagen Phaeton W12
2007 Volvo S80 V8 AWD
2007 Volvo XC90 V8 Sport
2005 Volvo XC90 V8
2003 Volvo XC90 2.5T
Thursday 25 September 2008
No improvement in fuel consumption
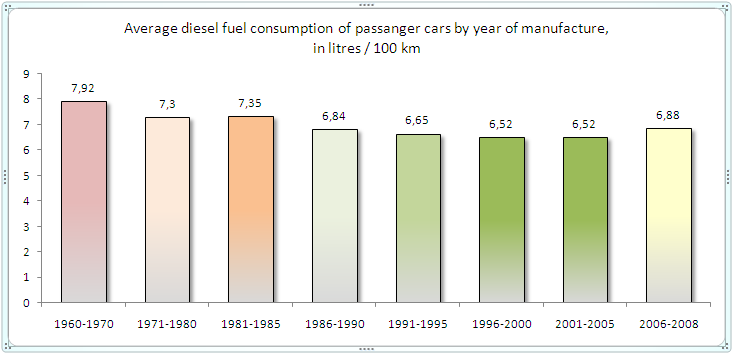
For 40 years of automotive development...

there has been virtually no improvement in fuel economy.
See it yourself.
Source is The Spritmonitor, a website where drivers, mostly from German-speaking countries, share observed, real fuel economy of cars they own and drive on daily basis.
Here is the outlook for diesel cars:
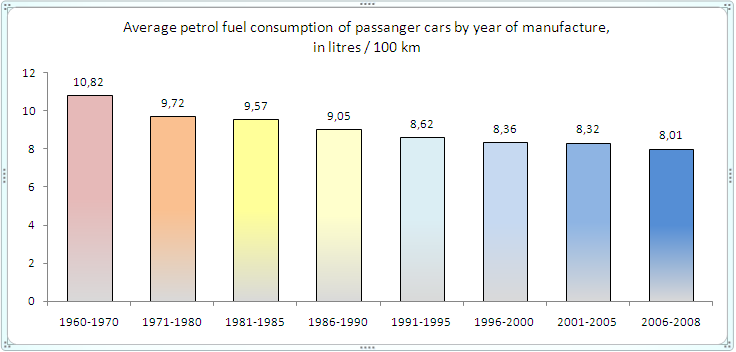
And here goes for petrol ones:

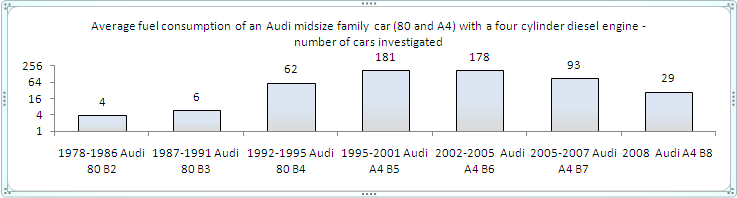
And that's how the matters look for a selected case - a diesel powered Audi midsize family car...
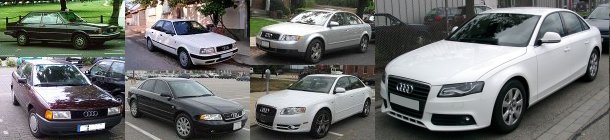
...with a for cylinder engine (six cylinder diesels have been excluded):

Why is the improvement so pitiful or sometimes even there isn't any?
Two main reasons stand for this.
First off, any improvements in engines combustion process has been cannibalized by customers constantly raising requirements for cars to offer more than just travelling capability. Additional safety and comfort and space inside (translating to larger, heavier bodies) all add weight. Modern cars have to carry reinforced body structures, systems for controlling braking, power and damping distribution, airbags, seatbelt pretensioners, safety padding as well as automatic gearboxes, better sound insulation, climate controls, sound systems and electric assistance in just everything, even activities as rare as adjusting seats and mirrors. Moreover, customers demands cars accelerating faster and faster, despite living in a world of speed limits. This pushes engines sizes and weights up. Poshness also makes things worse. Wider tires and larger car body (SUV fashion) increase tire rolling resistance and drag, respectively, when in motion.
But there's more essential reason - upper limit of efficiency an internal combustion engine (ICE) can reach, imposed by limitation of Carnot cycle, an idealizing model of how heat engines work. The only part of combustion energy an ICE can put to good use is when mixture of fuel and oxygen increases its volume when burning and therefore turning into exhaust gas. Increased pressure pushes pistons down what is then converted into rotating motion. And that's it. Except of cases when very small fraction of heat energy warms the car cabin, all the heat (some of pressure too, due to kinetic energy of exhaust gases) is wasted.
Put all that together and what you have is virtually no gain in fuel economy over 40 years.
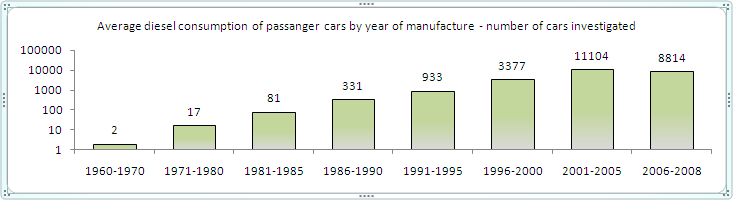
Some may argue that small number of old cars may not represent overall average consumption well. That can be true for very low figures (say, less than 10), but random nature of selection increases the chance to produce correct simulation result, particularly when the sample becomes large. Such one would also at least partially represent market breakdown in terms of cars sizes and, therefore, fuel economy classes. Computing average fuel consumption very precisely is also not really the purpose. It's rather a simulation of where we are in terms of improving fuel economy and how we performed over the years. The estimates may be wrong (and to little extent, they certainly are) but a giant leap in the matter would have been spotted already when investigating just a dozen of randomly chosen cars. Nothing like this was observed. Notable is that for a selected case of a popular vehicle, Audi mid-size diesel family car, where chances of miscalculation drop dramatically, generic trend was the same as for the entire bulk. This supports credibility of the overall observation.
Others may suggest that, in fact, there's been great increase in fuel economy over time since modern cars are much more powerful than the ones in the past and yet, they use similar amount of fuel. While this statement is true, it's necessary to realize that for most of its usage, a car either moves at a constant pace on highways/motorways or calmly accelerates in dense traffic, limited by other vehicles on the road. Foot hard down to use all the power is a rare event. This was true years ago and is now and it's the activity performed most of the time what has largest share in the amount of fuel consumed. A car now can have 150HP while its predecessor had 80, still only, say, 40HP will be used for 95% of the ride.
Sources
Data have been accessed on 24.09.2008. When accessed now, results may vary since Spritmonitor users constantly add fuel consumption data and userbase changes also. Still though, changes are expected to be so little they can be considered insignificant.
Diesel cars:
1960-1970
1971-1980
1981-1985
1986-1990
1991-1995
1996-2000
2001-2005
2005-2008
Petrol cars:
1960-1970
1971-1980
1981-1985
1986-1990
1991-1995
1996-2000
2005-2008
2005-2008
Audi midsize diesel family car:
Audi 80 B2 1978-1986
Audi 80 B3 1987-1991
Audi 80 B4 1992-1995
Audi A4 B5 1995-2001
Audi A4 B6 2002-2005
Audi A4 B7 2006-2007
Audi A4 B8 2008
there has been virtually no improvement in fuel economy.
See it yourself.
Source is The Spritmonitor, a website where drivers, mostly from German-speaking countries, share observed, real fuel economy of cars they own and drive on daily basis.
Here is the outlook for diesel cars:
And here goes for petrol ones:
And that's how the matters look for a selected case - a diesel powered Audi midsize family car...
...with a for cylinder engine (six cylinder diesels have been excluded):
Why is the improvement so pitiful or sometimes even there isn't any?
Two main reasons stand for this.
First off, any improvements in engines combustion process has been cannibalized by customers constantly raising requirements for cars to offer more than just travelling capability. Additional safety and comfort and space inside (translating to larger, heavier bodies) all add weight. Modern cars have to carry reinforced body structures, systems for controlling braking, power and damping distribution, airbags, seatbelt pretensioners, safety padding as well as automatic gearboxes, better sound insulation, climate controls, sound systems and electric assistance in just everything, even activities as rare as adjusting seats and mirrors. Moreover, customers demands cars accelerating faster and faster, despite living in a world of speed limits. This pushes engines sizes and weights up. Poshness also makes things worse. Wider tires and larger car body (SUV fashion) increase tire rolling resistance and drag, respectively, when in motion.
But there's more essential reason - upper limit of efficiency an internal combustion engine (ICE) can reach, imposed by limitation of Carnot cycle, an idealizing model of how heat engines work. The only part of combustion energy an ICE can put to good use is when mixture of fuel and oxygen increases its volume when burning and therefore turning into exhaust gas. Increased pressure pushes pistons down what is then converted into rotating motion. And that's it. Except of cases when very small fraction of heat energy warms the car cabin, all the heat (some of pressure too, due to kinetic energy of exhaust gases) is wasted.
Put all that together and what you have is virtually no gain in fuel economy over 40 years.
Some may argue that small number of old cars may not represent overall average consumption well. That can be true for very low figures (say, less than 10), but random nature of selection increases the chance to produce correct simulation result, particularly when the sample becomes large. Such one would also at least partially represent market breakdown in terms of cars sizes and, therefore, fuel economy classes. Computing average fuel consumption very precisely is also not really the purpose. It's rather a simulation of where we are in terms of improving fuel economy and how we performed over the years. The estimates may be wrong (and to little extent, they certainly are) but a giant leap in the matter would have been spotted already when investigating just a dozen of randomly chosen cars. Nothing like this was observed. Notable is that for a selected case of a popular vehicle, Audi mid-size diesel family car, where chances of miscalculation drop dramatically, generic trend was the same as for the entire bulk. This supports credibility of the overall observation.
Others may suggest that, in fact, there's been great increase in fuel economy over time since modern cars are much more powerful than the ones in the past and yet, they use similar amount of fuel. While this statement is true, it's necessary to realize that for most of its usage, a car either moves at a constant pace on highways/motorways or calmly accelerates in dense traffic, limited by other vehicles on the road. Foot hard down to use all the power is a rare event. This was true years ago and is now and it's the activity performed most of the time what has largest share in the amount of fuel consumed. A car now can have 150HP while its predecessor had 80, still only, say, 40HP will be used for 95% of the ride.
Sources
Data have been accessed on 24.09.2008. When accessed now, results may vary since Spritmonitor users constantly add fuel consumption data and userbase changes also. Still though, changes are expected to be so little they can be considered insignificant.
Diesel cars:
1960-1970
1971-1980
1981-1985
1986-1990
1991-1995
1996-2000
2001-2005
2005-2008
Petrol cars:
1960-1970
1971-1980
1981-1985
1986-1990
1991-1995
1996-2000
2005-2008
2005-2008
Audi midsize diesel family car:
Audi 80 B2 1978-1986
Audi 80 B3 1987-1991
Audi 80 B4 1992-1995
Audi A4 B5 1995-2001
Audi A4 B6 2002-2005
Audi A4 B7 2006-2007
Audi A4 B8 2008
Saturday 23 August 2008
Hybrid vs diesel fuel consumption comparison
Quite a lot of fuel consumption comparisons among hybrid and diesel cars have already been or are run these days so here comes mine. This one, however, isn’t based on single test cases performed by automotive editors in specific atmospheric, road and vehicle wear and tear and driving habits conditions but on “real life” fuel consumption observed over a long time and published by cars owners on an excellent monitoring web page Spritmonitor.
Conclusions
1. It’s almost certain that a plug-in hybrid system is the way to go in terms of oil independence for (at least) automotive applications. Please see the comments for further information.
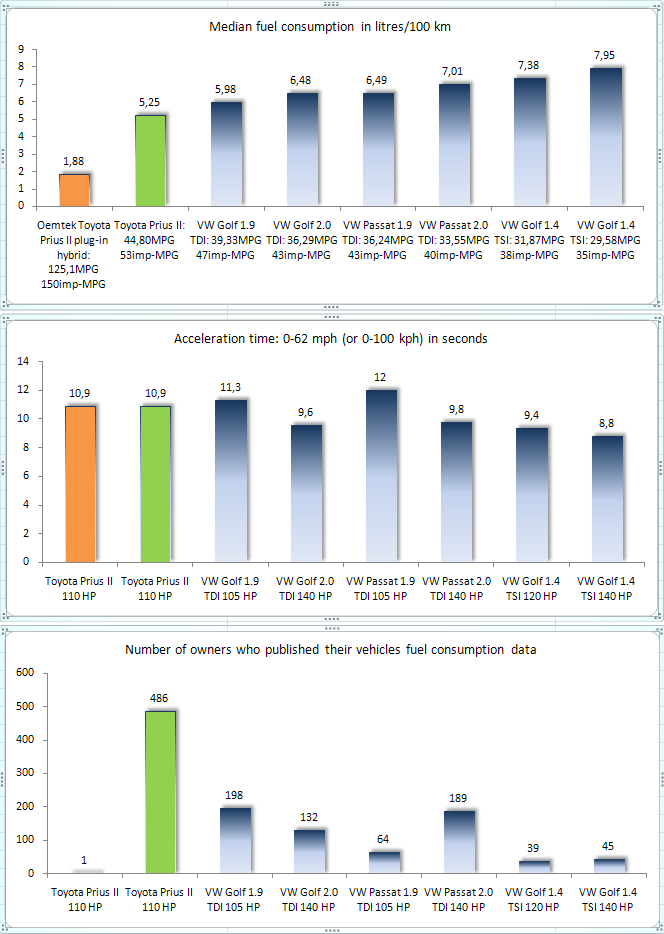
2. In compact and midsize cars, a hybrid drivetrain in its current setup provides same sort of fuel consumption advantage over a diesel-powered car as diesel-powered cars can provide over their state-of-the-art petrol counterparts. This applies to cars with very similar performance. Toyota Prius II uses roughly a liter of fuel less than most frugal VW Golf and Passat 1.9 TDI achieve when averaged (due to the Prius falling somewhere between those two cars in terms of size). The same liter of fuel more over average consumption of these diesels is needed to cover about 60 miles (~100 km) with a VW Golf TSI 120 HP. It’s worth noting however that some fraction of mileage advantage Prius offers is related to its very aerodynamic water-drop shape, low-grip tires and continuously variable transmission (CVT), none of the features VWs possess.
3. In midsize SUV category, the situation is far more surprising. While the Lexus RX 400h hybrid fares better than most diesels which either consume essentially more while not being able to match the hybrid performance or consume much more when performing equally good (this applies to V8 diesels with very heavy drivetrain components to withstand extremely high torque), BMW offers diesels which excel the hybrid easily. This does not only show in case of lighter and smaller X3, but also in case of full-size X5 with twin-turbo 3-litre diesel engine which is even quicker than the RX 400h and consumes less as well. Because technically most advanced competitors were present in the comparison, it turns out that BMW became the best diesel manufacturer in terms of performance and fuel economy in the world as for now. It’s also likely that, after the appearance of twin-turbocharged diesel cars from other manufacturers, non plug-in hybrid drivetrain in its current form may no longer be the benchmark of mileage in automotive industry.
See it for yourself
Compact and mid-size cars.
Mid-size SUVs.

Comments to this research
This comparison considers raw fuel consumption only, not the cost-saving and environmental factors (partly due to complexity of such analyses and prices of petrol and diesel fuel getting nearly equal at the time of writing).
Beside hybrids currently in production and widely available, a modified versions of Toyota Prius and Ford Escape Hybrid (which uses same Hybrid Synergy Drive technology) offered by Oemtek company [1] were confronted with all the rest. These aftermarket modifications install an additional battery pack, rendering the car a plug-in hybrid since it can be charged at home using a standard socket and then cover about 30 miles (about 50 km) running on electricity only. The manufacturer claims extremely impressive fuel consumption figures. This however, in my opinion can be achieved only when travelling short distances. That’s the only situation when the car can cover say a half of the distance without using its internal combustion engine. Still, since I believe most of drivers don’t travel more than 60 miles (~100 km) per day, a plug-in hybrid appears to be the way to go if the goal is to slash dependence on oil. Further reasons for a plug-in hybrid drivetrain to succeed are its long range (on petrol) if needed and already available charging infrastructure (electricity net), a statement false for any hydrogen-powered vehicle. Energy needed to power a plug-in hybrid car can be produced from sources (like nuclear, hydroelectric and coal power plants or natural gas) which are far less likely to deplete as quick as crude oil will probably do [2].
Since Toyota Prius is not easy to classify, it was compared with both VW Golf (which in its 4-door version is a bit longer than Prius but has much shorter wheelbase) and VW Passat (same wheelbase as Prius but overall longer). Two VWs have been picked as these are most popular cars [3][4] in its class in Europe. EuroNCAP classifies Prius as a large family car [5] which competes with Passat rather than Golf.
Following versions or makes of vehicles were compared: Toyota Prius II, VW Golf mkV, VW Passat B6, first makes of Lexus RX 400h, VW Touareg, Audi Q7 and Volvo XC90, second makes of Mercedes ML and BMW X5s as stated on the charts.
After realizing how well modern BMW diesels perform against hybrids in SUV territory, fuel consumption of BMW 118d (the 105 kW version of the engine, after first remake) was checked if it can beat selected contenders but with average consumption of 6,17 l/100 km (38,2 MPG or 45,8 imp-MPG) it was decided it can’t provide any new significant perspective to this comparison.
BMW X3 3.0d was picked despite its general classification as a compact crossover SUV [6] while the Lexus RX 400h is considered a midsize crossover SUV [7] as it has very similar wheelbase to the hybrid SUV tested.
Volkswagen 1.4 TSI engines were added to the comparison as, in my opinion, these are currently the best petrol powerplants on the market due to their low cubic capacity, presence of forced induction (turbocharger in the low output version and, additionally a supercharger in the more powerful one) and very desirable driving characteristics, with relatively much power in the low revs band (high torque). Presence of TSI engines was considered a good example of how much fuel consumption advantage can a modern diesel and hybrid setup provide over a modern petrol engine.
Audi Q7 is included in this comparison only for a SUV representing VW AG TDI technology in application other than relatively heavy duty off-roading (like in VW Touareg, a SUV much heavier than most of its competition) to be present in the comparison. Meanwhile, one needs to realize Q7 is not a mid-size SUV but a full-size one.
[1] http://www.oemtek.com/products.html
[2] http://en.wikipedia.org/wiki/Peak_oil
[3] Most popular compact cars in Europe in 2007
[4] Most popular midsize cars in Europe in 2007
[5]EuroNCAP Toyota Prius classification
[6] http://en.wikipedia.org/wiki/BMW_X3
[7] http://en.wikipedia.org/wiki/Lexus_RX400h
Spritmonitor fuel consumption sources and 0-62 mph (0-100 kph) acceleration sources:
Fuel consumption data:
Toyota Prius II
VW Golf 2.0 TDI
VW Passat 2.0 TDI
VW Golf 1.9 TDI
VW Passat 1.9 TDI 105
VW Golf TSI 120 HP
VW Golf TSI 140 HP
Lexus RX 400h
VW Touareg 2.5 TDI
VW Touareg 3.0 TDI
VW Touareg V10 TDI
Mercedes ML 320 CDI
BMW X5 3.0d E53
BMW X5 3.0d E70
BMW X5 E70 3.0sd
Mercedes ML 420 CDI
BMW X3 3.0d
Volvo XC90 d5
Audi Q7 3.0 TDI
Acceleration data:
AMiS 2005/11 for Volvo XC90 d5, Mercedes ML 320 CDI, VW Touareg 3.0 TDI, BMW X5 3.0d E53.
Passat 2.0 TDI
Golf 2.0 TDI
Golf 1.9 TDI
Passat 1.9 TDI 105 HP
BMW X5 3.0sd
Golf TSI
Touareg V10 TDi Mercedes ML 420 CDi
Lexus RX 400h
Toyota Prius II
Conclusions
1. It’s almost certain that a plug-in hybrid system is the way to go in terms of oil independence for (at least) automotive applications. Please see the comments for further information.
2. In compact and midsize cars, a hybrid drivetrain in its current setup provides same sort of fuel consumption advantage over a diesel-powered car as diesel-powered cars can provide over their state-of-the-art petrol counterparts. This applies to cars with very similar performance. Toyota Prius II uses roughly a liter of fuel less than most frugal VW Golf and Passat 1.9 TDI achieve when averaged (due to the Prius falling somewhere between those two cars in terms of size). The same liter of fuel more over average consumption of these diesels is needed to cover about 60 miles (~100 km) with a VW Golf TSI 120 HP. It’s worth noting however that some fraction of mileage advantage Prius offers is related to its very aerodynamic water-drop shape, low-grip tires and continuously variable transmission (CVT), none of the features VWs possess.
3. In midsize SUV category, the situation is far more surprising. While the Lexus RX 400h hybrid fares better than most diesels which either consume essentially more while not being able to match the hybrid performance or consume much more when performing equally good (this applies to V8 diesels with very heavy drivetrain components to withstand extremely high torque), BMW offers diesels which excel the hybrid easily. This does not only show in case of lighter and smaller X3, but also in case of full-size X5 with twin-turbo 3-litre diesel engine which is even quicker than the RX 400h and consumes less as well. Because technically most advanced competitors were present in the comparison, it turns out that BMW became the best diesel manufacturer in terms of performance and fuel economy in the world as for now. It’s also likely that, after the appearance of twin-turbocharged diesel cars from other manufacturers, non plug-in hybrid drivetrain in its current form may no longer be the benchmark of mileage in automotive industry.
See it for yourself
Compact and mid-size cars.
Mid-size SUVs.
Comments to this research
This comparison considers raw fuel consumption only, not the cost-saving and environmental factors (partly due to complexity of such analyses and prices of petrol and diesel fuel getting nearly equal at the time of writing).
Beside hybrids currently in production and widely available, a modified versions of Toyota Prius and Ford Escape Hybrid (which uses same Hybrid Synergy Drive technology) offered by Oemtek company [1] were confronted with all the rest. These aftermarket modifications install an additional battery pack, rendering the car a plug-in hybrid since it can be charged at home using a standard socket and then cover about 30 miles (about 50 km) running on electricity only. The manufacturer claims extremely impressive fuel consumption figures. This however, in my opinion can be achieved only when travelling short distances. That’s the only situation when the car can cover say a half of the distance without using its internal combustion engine. Still, since I believe most of drivers don’t travel more than 60 miles (~100 km) per day, a plug-in hybrid appears to be the way to go if the goal is to slash dependence on oil. Further reasons for a plug-in hybrid drivetrain to succeed are its long range (on petrol) if needed and already available charging infrastructure (electricity net), a statement false for any hydrogen-powered vehicle. Energy needed to power a plug-in hybrid car can be produced from sources (like nuclear, hydroelectric and coal power plants or natural gas) which are far less likely to deplete as quick as crude oil will probably do [2].
Since Toyota Prius is not easy to classify, it was compared with both VW Golf (which in its 4-door version is a bit longer than Prius but has much shorter wheelbase) and VW Passat (same wheelbase as Prius but overall longer). Two VWs have been picked as these are most popular cars [3][4] in its class in Europe. EuroNCAP classifies Prius as a large family car [5] which competes with Passat rather than Golf.
Following versions or makes of vehicles were compared: Toyota Prius II, VW Golf mkV, VW Passat B6, first makes of Lexus RX 400h, VW Touareg, Audi Q7 and Volvo XC90, second makes of Mercedes ML and BMW X5s as stated on the charts.
After realizing how well modern BMW diesels perform against hybrids in SUV territory, fuel consumption of BMW 118d (the 105 kW version of the engine, after first remake) was checked if it can beat selected contenders but with average consumption of 6,17 l/100 km (38,2 MPG or 45,8 imp-MPG) it was decided it can’t provide any new significant perspective to this comparison.
BMW X3 3.0d was picked despite its general classification as a compact crossover SUV [6] while the Lexus RX 400h is considered a midsize crossover SUV [7] as it has very similar wheelbase to the hybrid SUV tested.
Volkswagen 1.4 TSI engines were added to the comparison as, in my opinion, these are currently the best petrol powerplants on the market due to their low cubic capacity, presence of forced induction (turbocharger in the low output version and, additionally a supercharger in the more powerful one) and very desirable driving characteristics, with relatively much power in the low revs band (high torque). Presence of TSI engines was considered a good example of how much fuel consumption advantage can a modern diesel and hybrid setup provide over a modern petrol engine.
Audi Q7 is included in this comparison only for a SUV representing VW AG TDI technology in application other than relatively heavy duty off-roading (like in VW Touareg, a SUV much heavier than most of its competition) to be present in the comparison. Meanwhile, one needs to realize Q7 is not a mid-size SUV but a full-size one.
[1] http://www.oemtek.com/products.html
[2] http://en.wikipedia.org/wiki/Peak_oil
[3] Most popular compact cars in Europe in 2007
[4] Most popular midsize cars in Europe in 2007
[5]EuroNCAP Toyota Prius classification
[6] http://en.wikipedia.org/wiki/BMW_X3
[7] http://en.wikipedia.org/wiki/Lexus_RX400h
Spritmonitor fuel consumption sources and 0-62 mph (0-100 kph) acceleration sources:
Fuel consumption data:
Toyota Prius II
VW Golf 2.0 TDI
VW Passat 2.0 TDI
VW Golf 1.9 TDI
VW Passat 1.9 TDI 105
VW Golf TSI 120 HP
VW Golf TSI 140 HP
Lexus RX 400h
VW Touareg 2.5 TDI
VW Touareg 3.0 TDI
VW Touareg V10 TDI
Mercedes ML 320 CDI
BMW X5 3.0d E53
BMW X5 3.0d E70
BMW X5 E70 3.0sd
Mercedes ML 420 CDI
BMW X3 3.0d
Volvo XC90 d5
Audi Q7 3.0 TDI
Acceleration data:
AMiS 2005/11 for Volvo XC90 d5, Mercedes ML 320 CDI, VW Touareg 3.0 TDI, BMW X5 3.0d E53.
Passat 2.0 TDI
Golf 2.0 TDI
Golf 1.9 TDI
Passat 1.9 TDI 105 HP
BMW X5 3.0sd
Golf TSI
Touareg V10 TDi Mercedes ML 420 CDi
Lexus RX 400h
Toyota Prius II
Thursday 14 August 2008
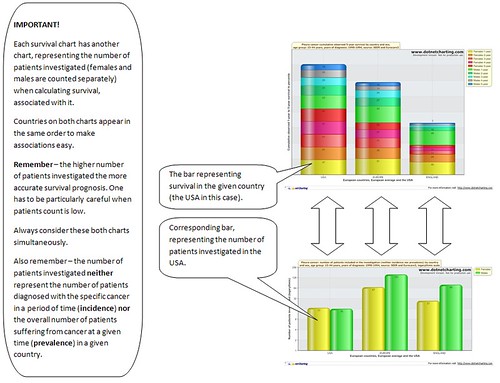
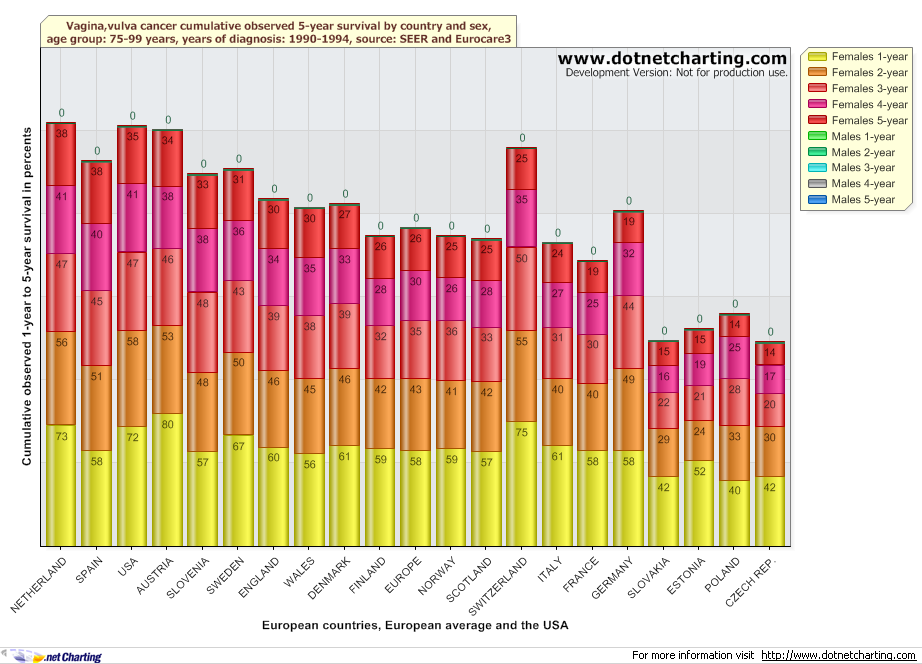
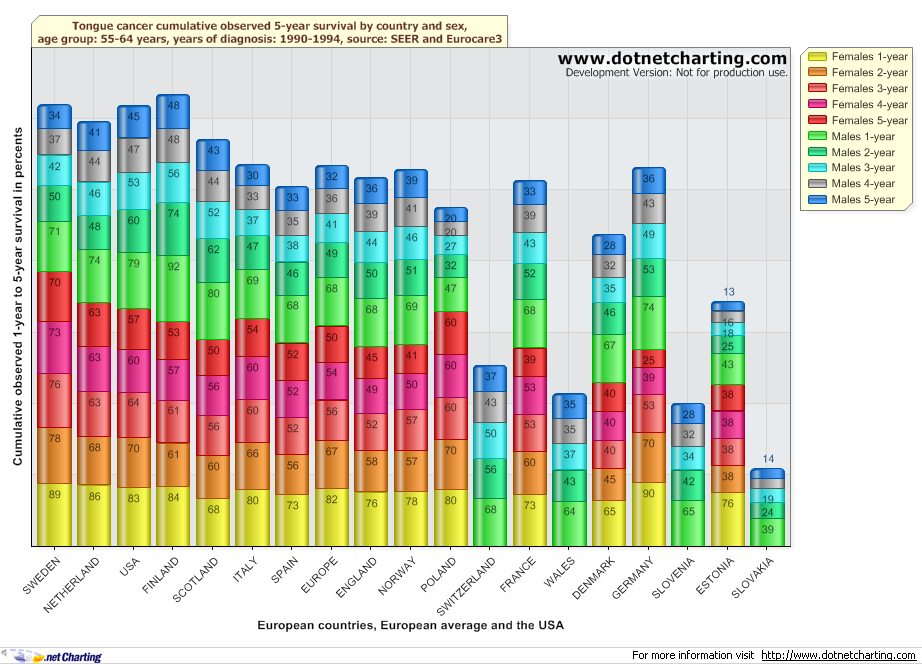
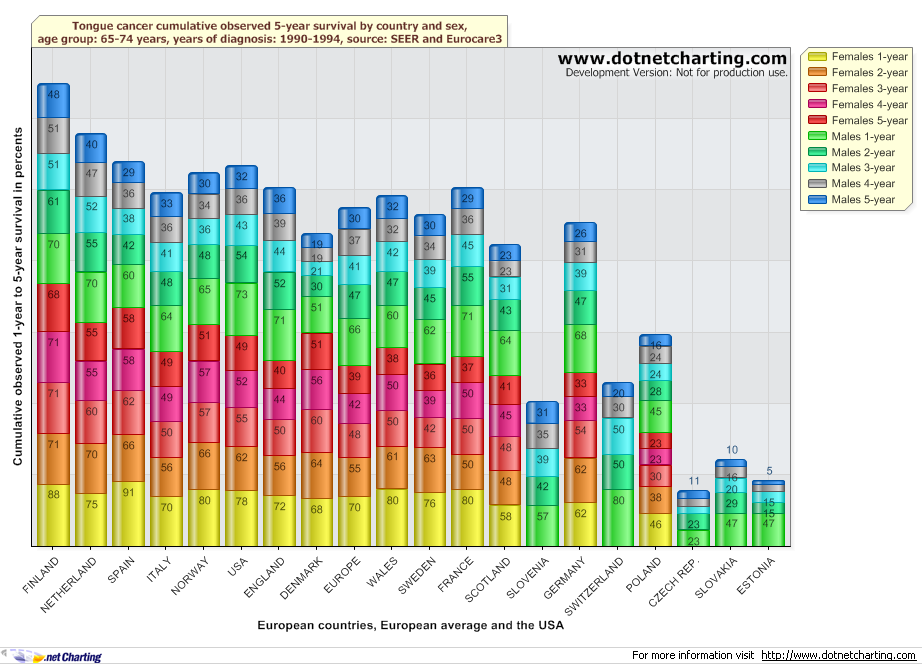
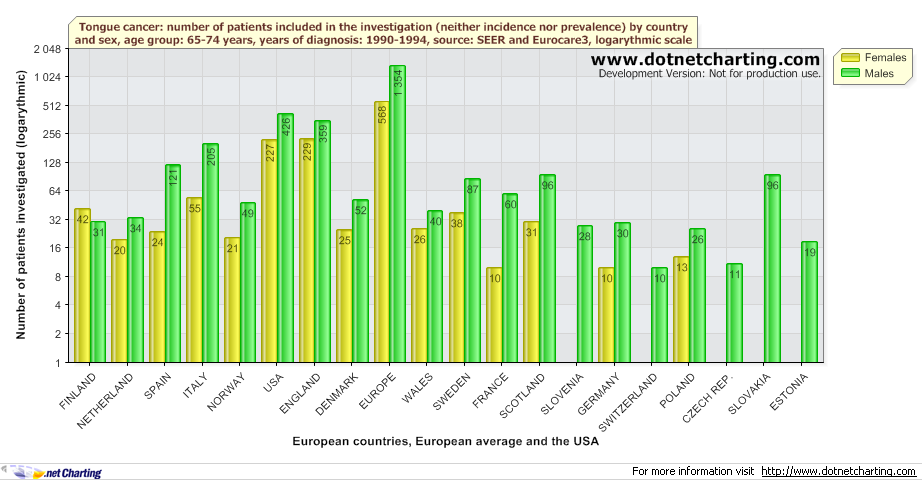
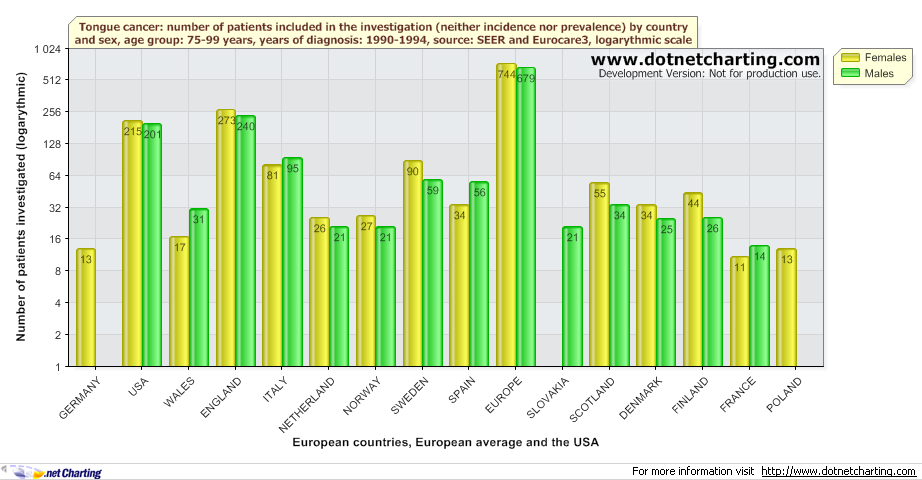
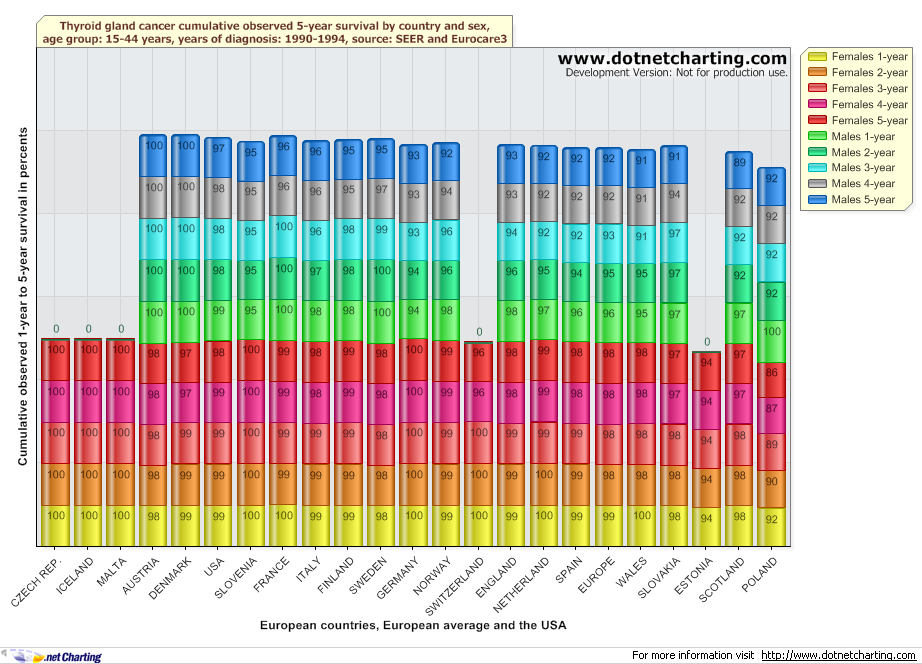
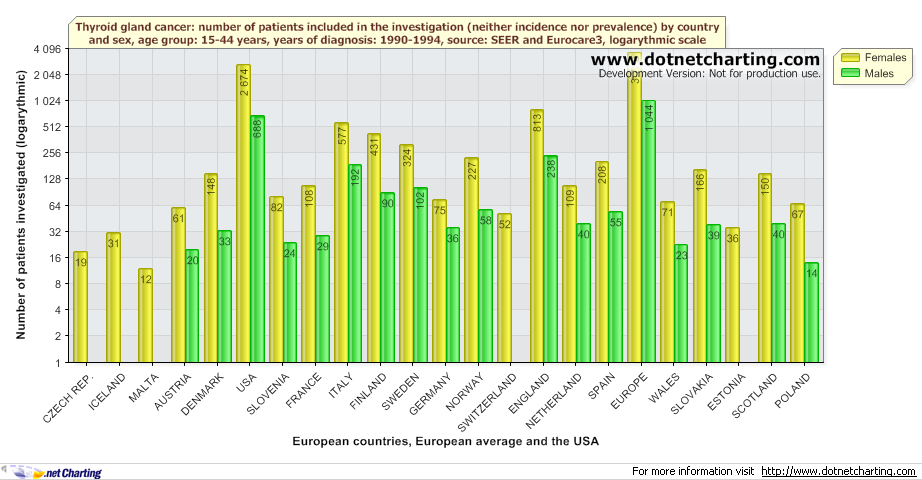
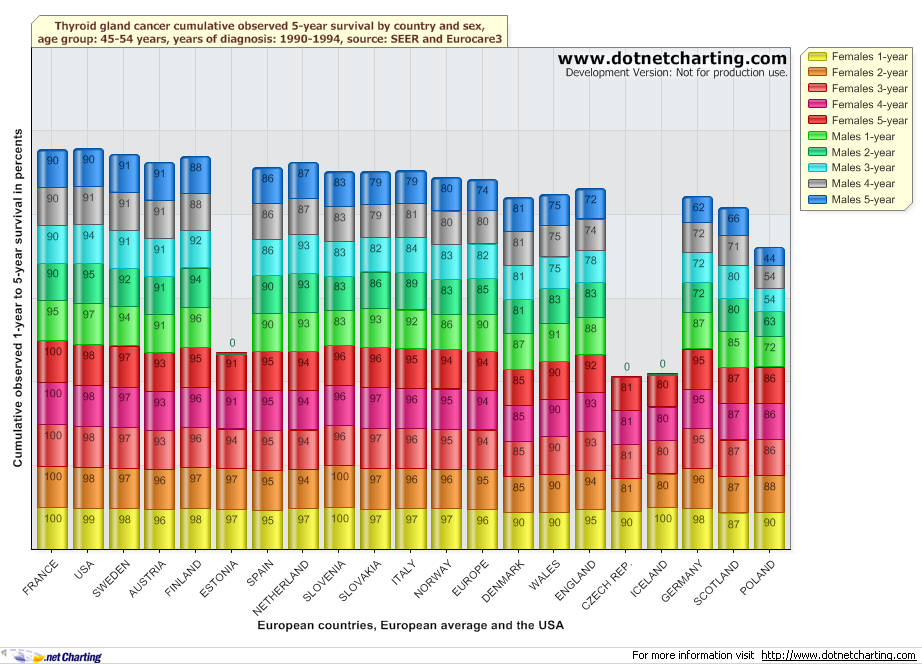
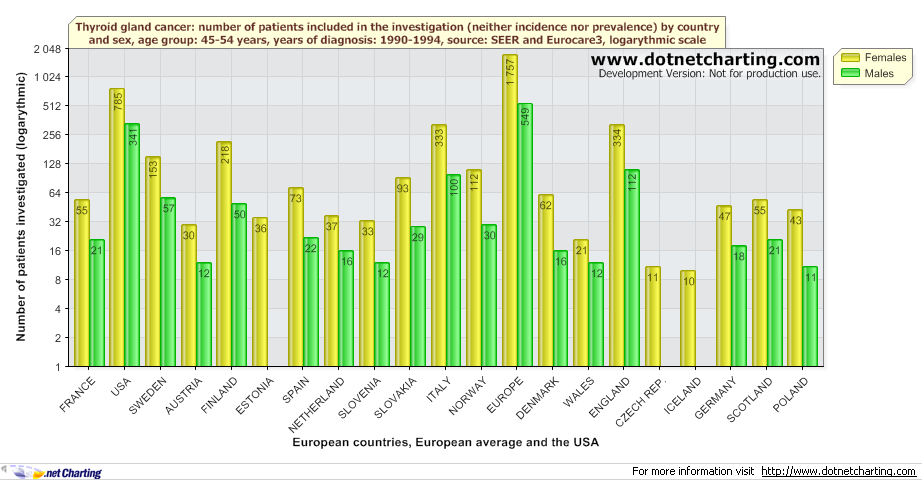
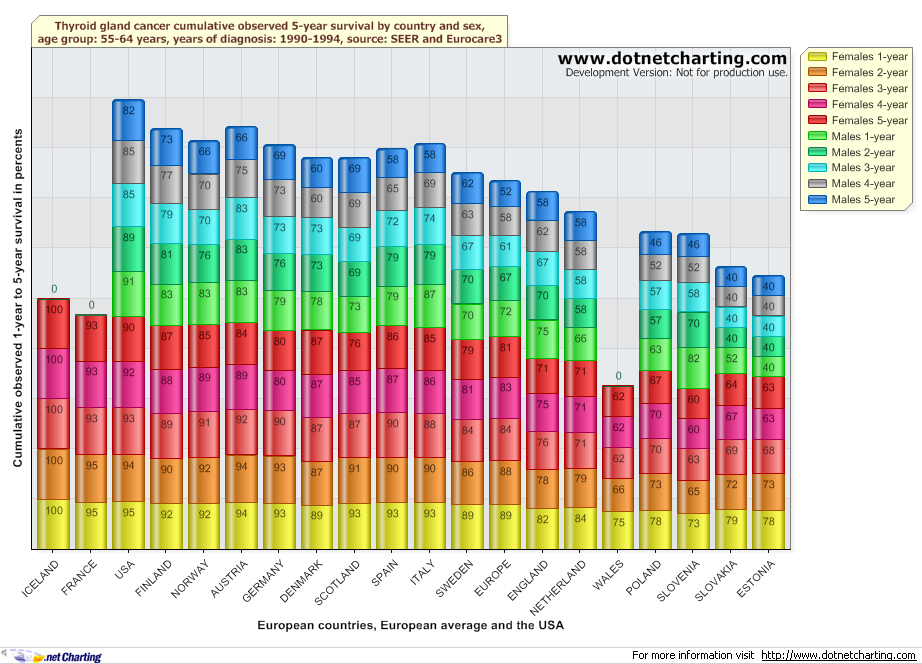
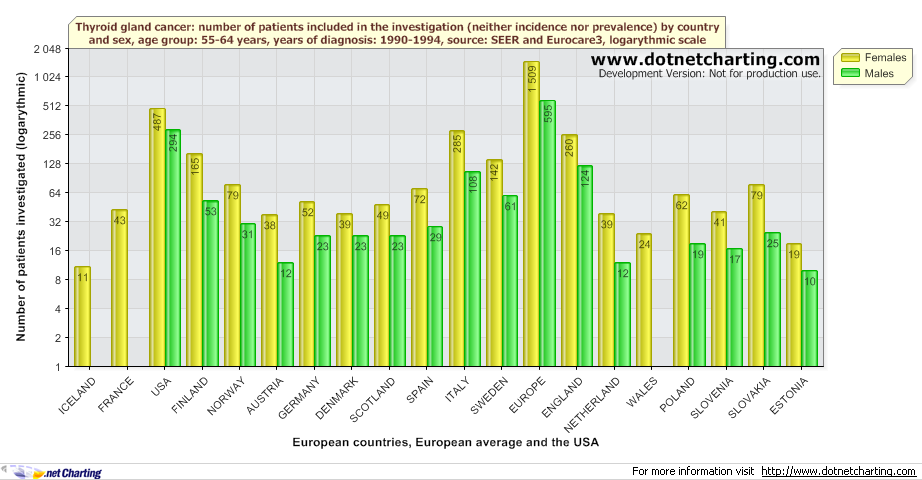
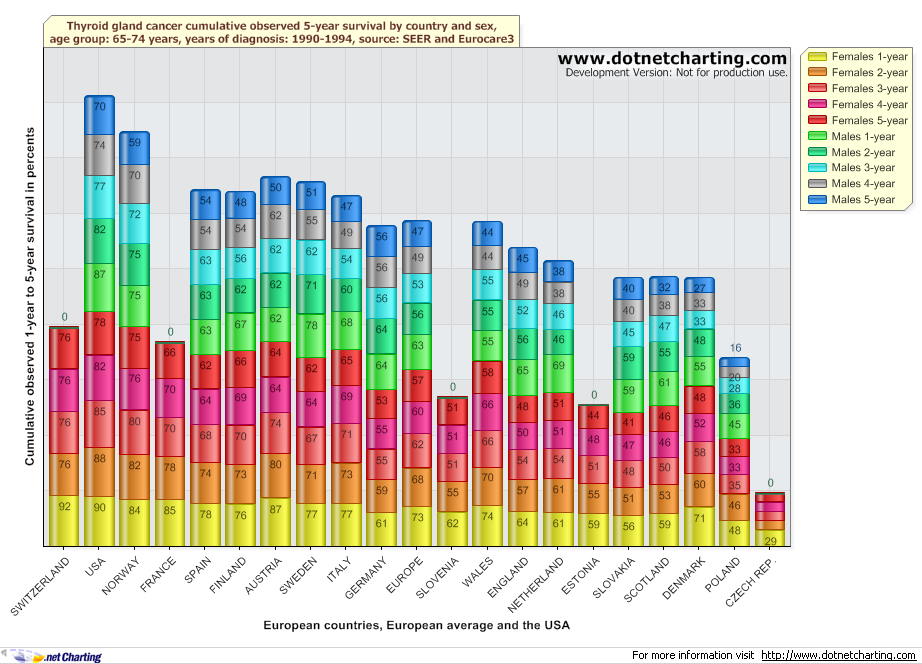
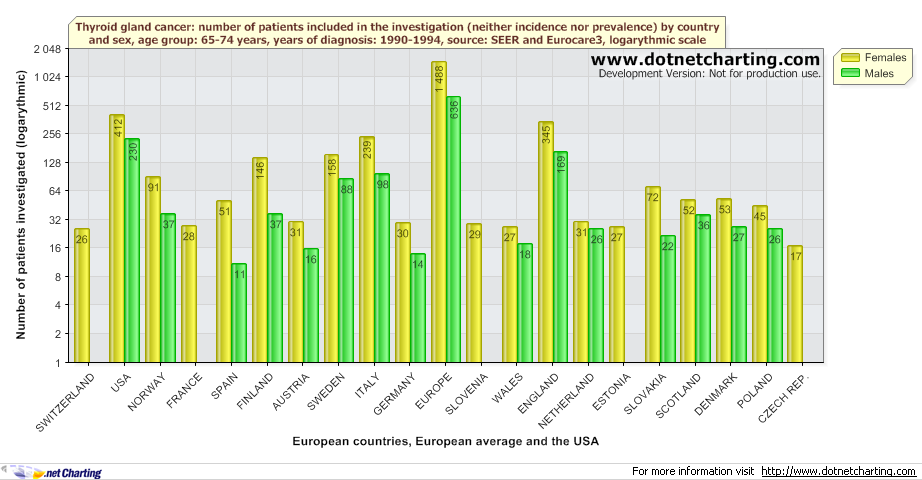
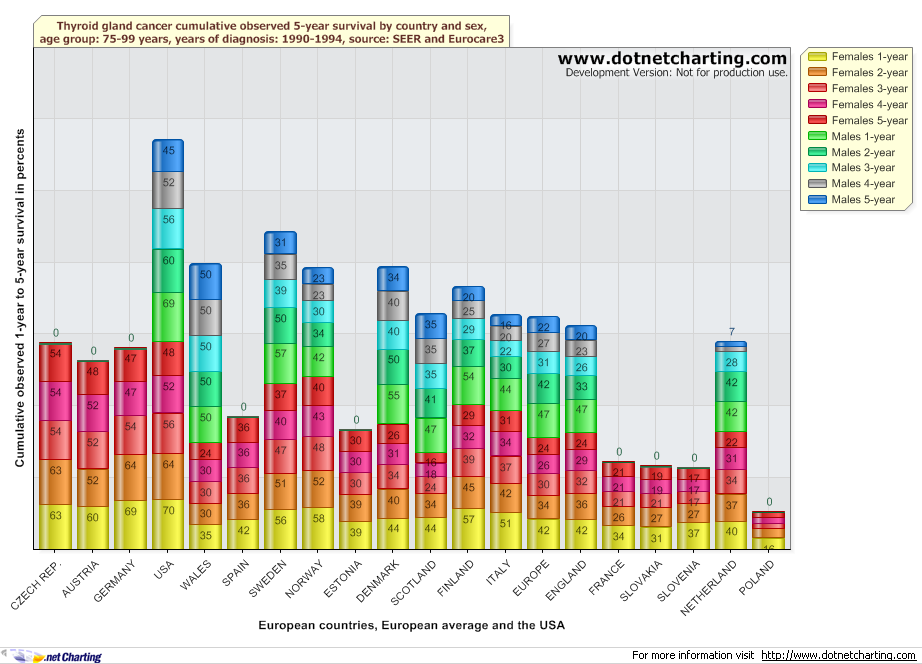
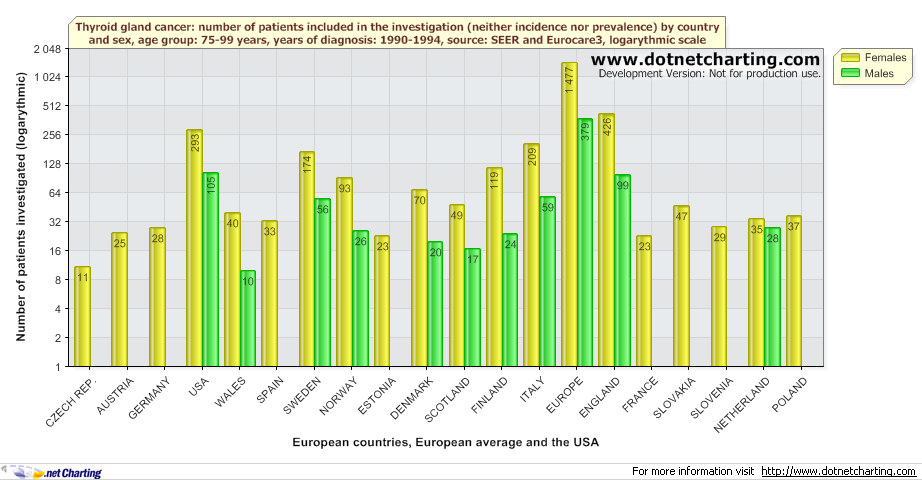
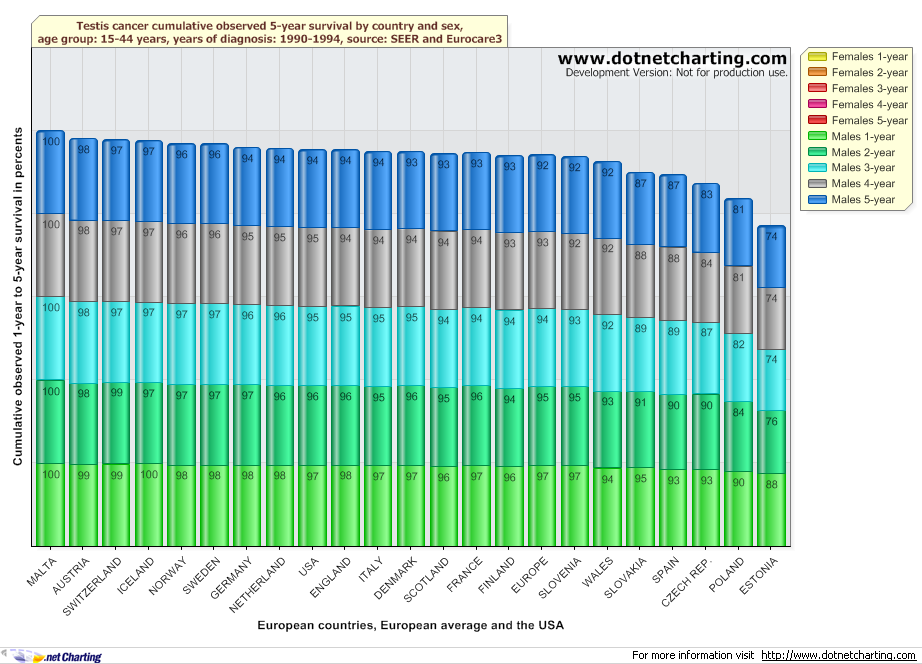
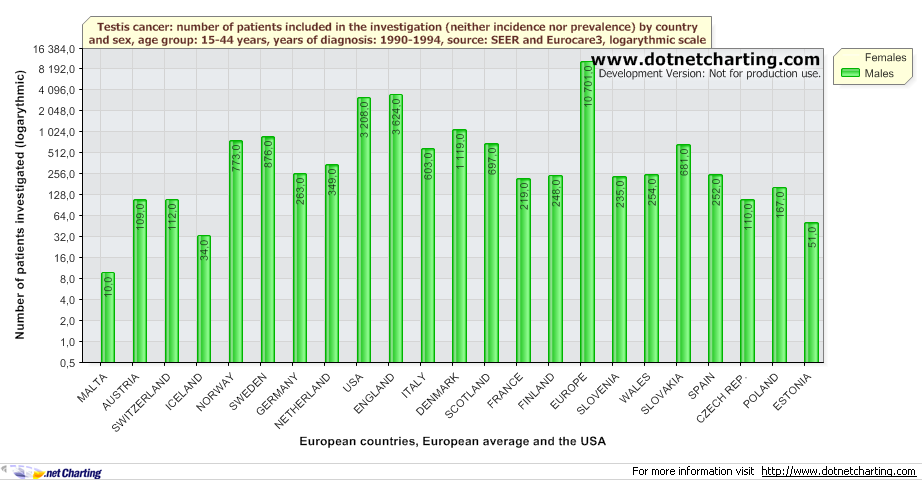
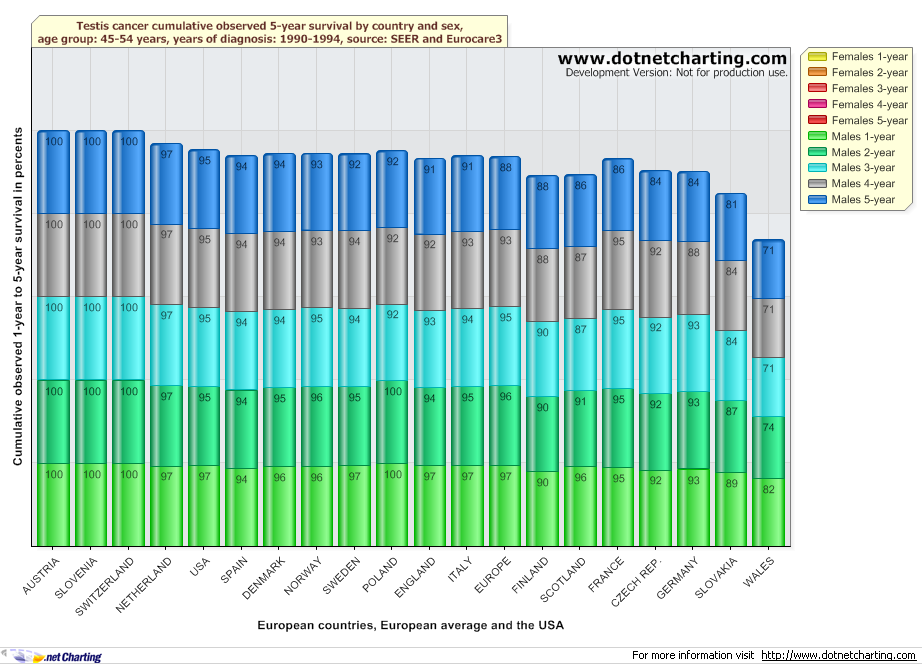
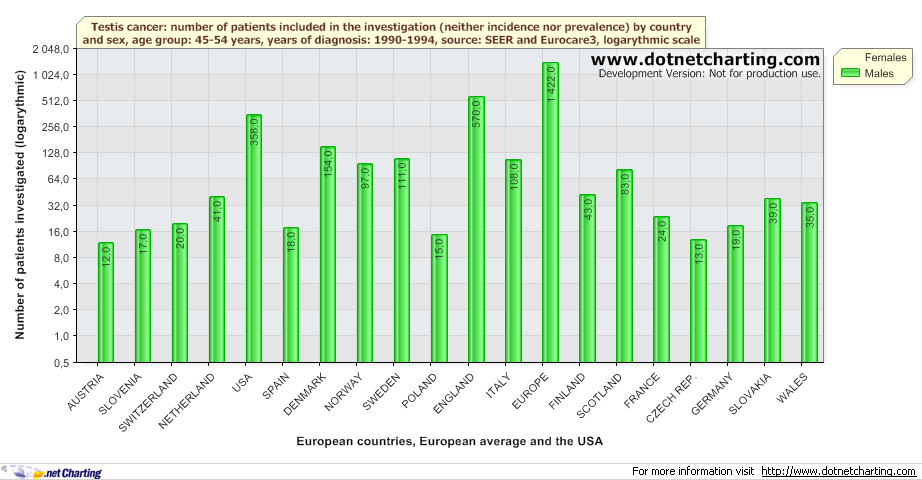
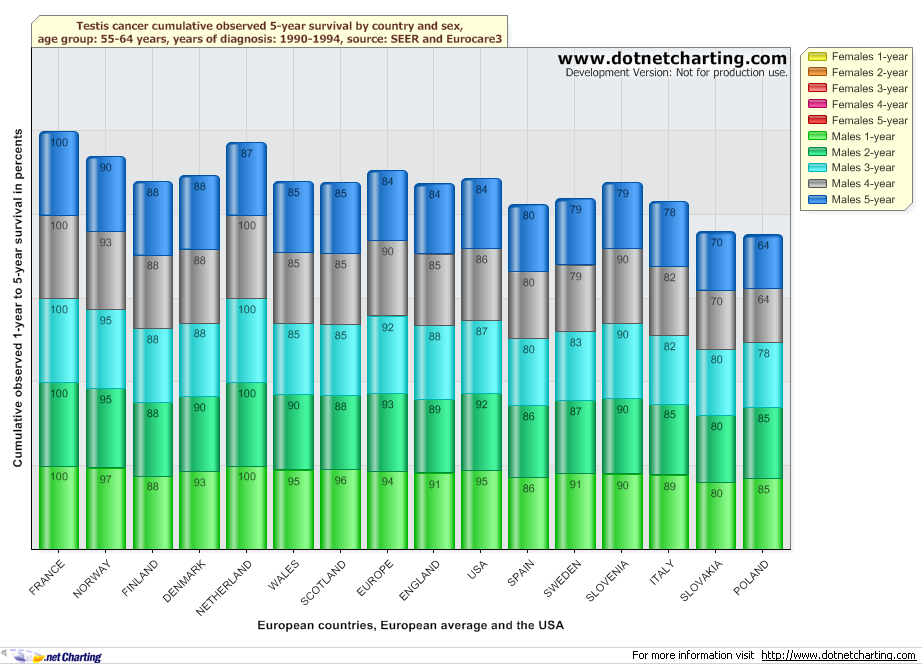
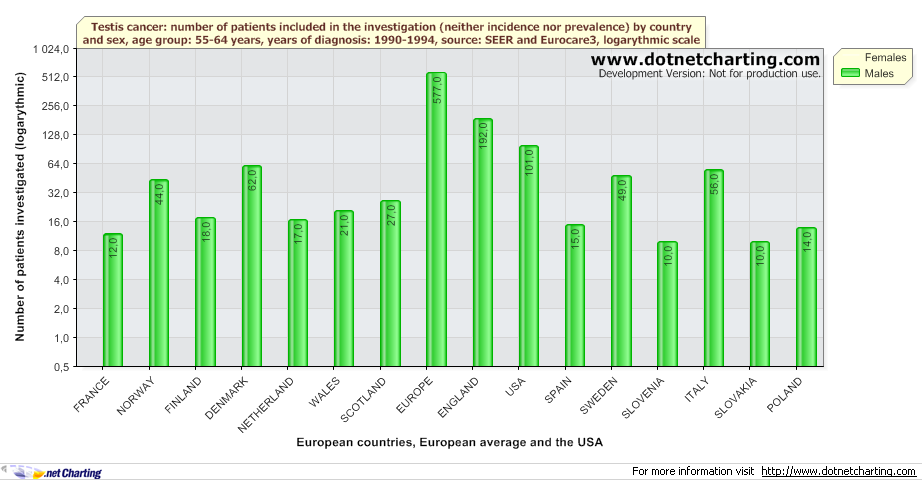
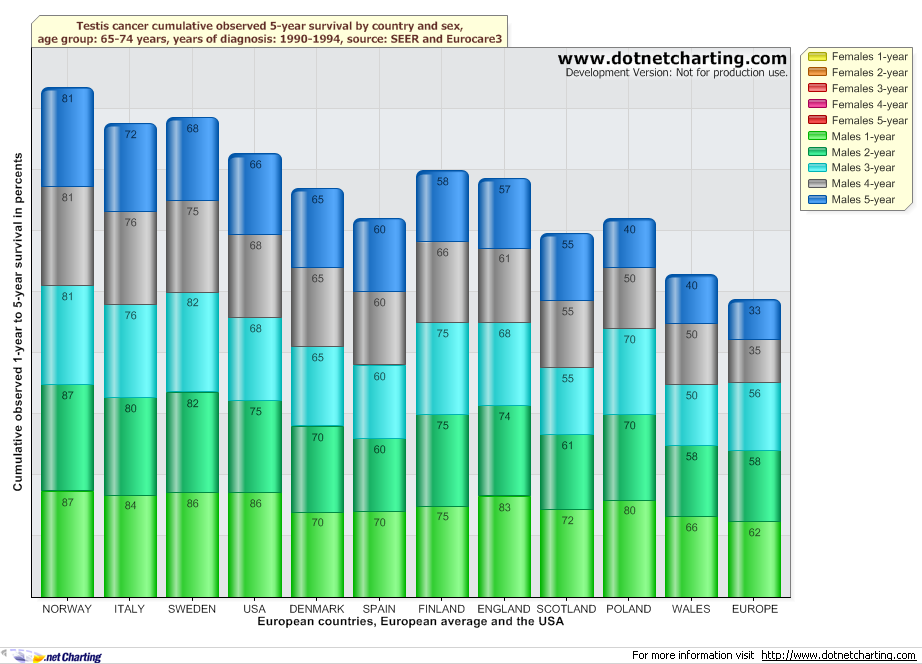
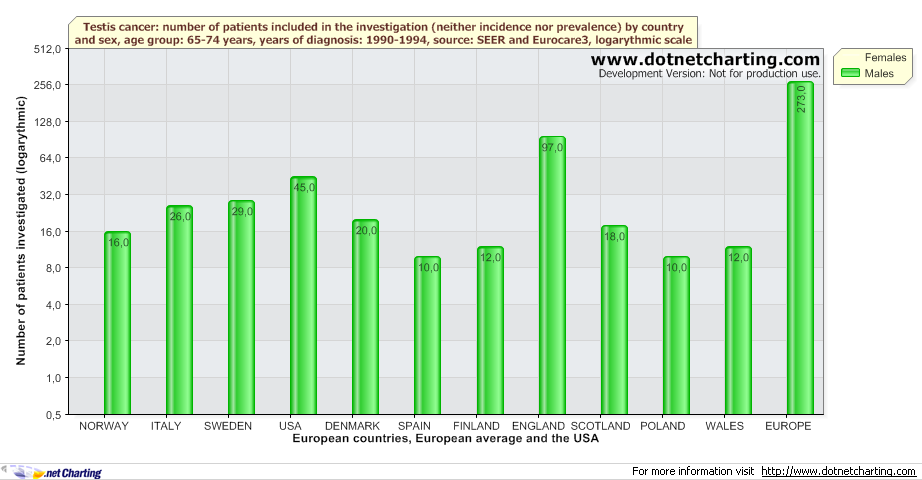
Comparison of cancer treatment efficiency in Europe and the USA
Results of a European study [1] comparing 5-year observed survival of 46 types of cancer, in patients diagnosed within the timespan of 1990-1994, in five age groups in selected European countries have been compiled with data extracted from USA SEER Surveillance Epidemiology and End Results database [2][3], concerning patients diagnosed at the same time, observed in the same period and suffering from same types of cancer.
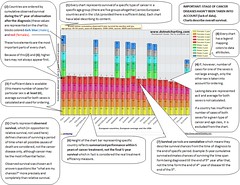
Eurocare 3 [1] findings have already been published in details [4], analyzed and widely discussed [5]. Still though, in my opinion, not all survival and treatment efficiency aspects of the study have found their way to audience understood as widely as Internet users community and those which have, aren't as easily readable as they could be. Therefore, presenting more comprehensive insight strictly into study results as well as comparing them with observed results in the USA are the purposes of this article. These were implemented by visualizing survival data for a Cartesian product of all cancer types, countries, survival periods and age groups available in the study.
While there are numerous factors influencing cancer survival, results of the study provide some judgment about performance and effectiveness of medical care systems in countries investigated.
Age groups differentiated in the study are: 15-44 years, 45-54 years, 55-64 years, 65-74 years, 75-99 years.
Survival periods are 1-year to 5-year, with a yearly step.
Countries displayed are: Austria, Czech Republic, Denmark, England, Estonia, Finland, France, Germany, Iceland, Italy, Malta, Netherlands, Norway, Poland, Portugal, Scotland, Slovakia, Slovenia, Spain, Sweden, Switzerland, USA and Wales. Additionally, country-weighted (in terms of countries populations) European averages have been presented.
Before viewing the charts, please have a look at pictures explaining how to read them.
Types of cancer discussed in this article:
- All Cancers
- Biliary tract cancer
- Bladder cancer
- Bone cancer
- Brain cancer
- Breast cancer
- Cervical (cervix uteri) cancer
- Choroid cancer
- Chronic lymphocytic (lymphoid) leukemia
- Chronic myelogenous (myeloid) leukemia
- Colon cancer
- Colon & Rectum (colorectal) cancer
- Corpus uteri (uterine) cancer
- Head & Neck
- Hodgkin's disease (Hodgkin's lymphoma)
- Hypopharynx cancer
- Kidney cancer
- Larynx (laryngeal) cancer
- Leukaemia
- Lip (oral) cancer
- Liver cancer
- Lung cancer
- Melanoma skin cancer
- Multiple myeloma
- Non-Hodgkin lymphoma
- Nasal cavities cancer
- Nasopharynx (nasopharyngeal) cancer
- Oesophagus (oesophageal) cancer
- Oral cavity cancer
- Oropharynx (oropharyngeal) cancer
- Ovary (ovarian) cancer
- Pancreas (pancreatic) cancer
- Penis (penile) cancer
- Pleura (pleural) cancer
- Prostate cancer
- Rectum (rectal) cancer
- Salivary glands cancer
- Small intestine cancer
- Soft tissues cancer
- Stomach cancer
- Testis (testicular) cancer
- Thyroid gland cancer
- Tongue cancer
- Vagina (vaginal) and vulva (vulvar) cancer
[1] http://www.eurocare.it/
[2] Surveillance, Epidemiology, and End Results (SEER) Program (www.seer.cancer.gov) SEER*Stat Database: Incidence - SEER 17 Regs Limited-Use + Hurricane Katrina Impacted Louisiana Cases, Nov 2007 Sub (1973-2005 varying) - Linked To County Attributes - Total U.S., 1969-2005 Counties, National Cancer Institute, DCCPS, Surveillance Research Program, Cancer Statistics Branch, released April 2008, based on the November 2007 submission.
[3] http://seer.cancer.gov/data/access.html
[4] http://annonc.oxfordjournals.org/cgi/reprint/14/suppl_5/v61.pdf
[5] http://annonc.oupjournals.org/content/vol14/suppl_5/
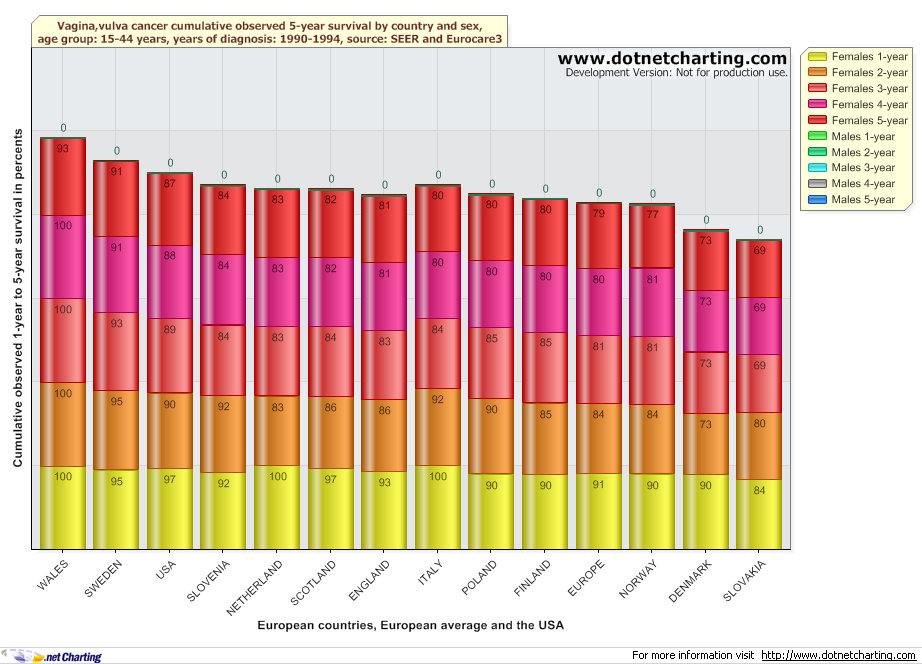
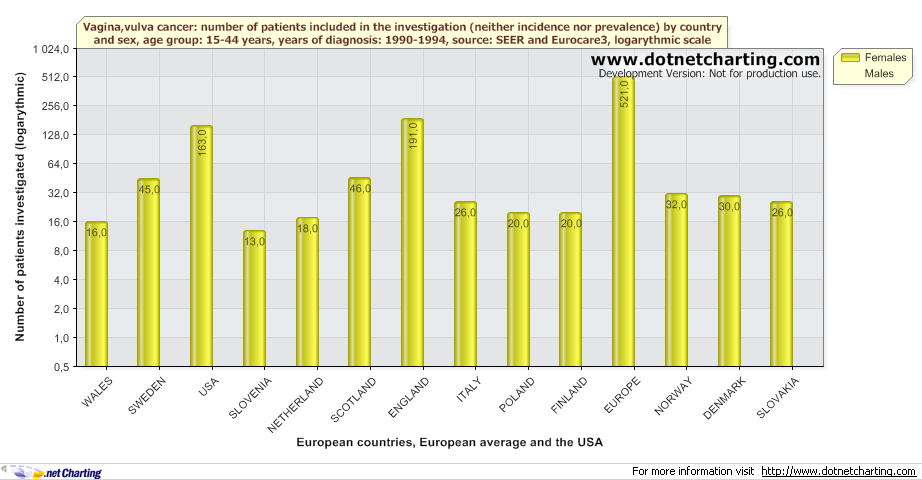
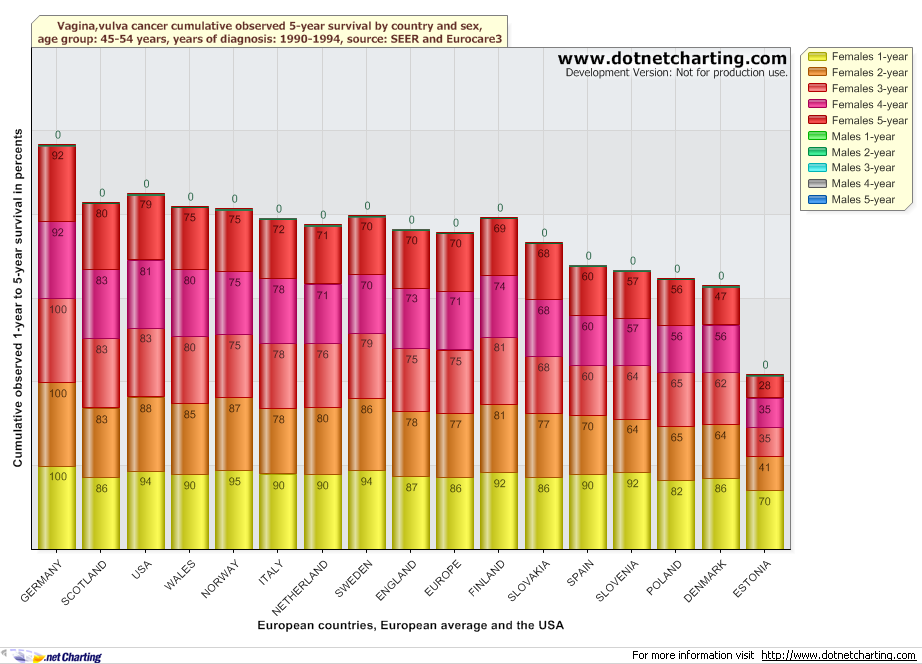
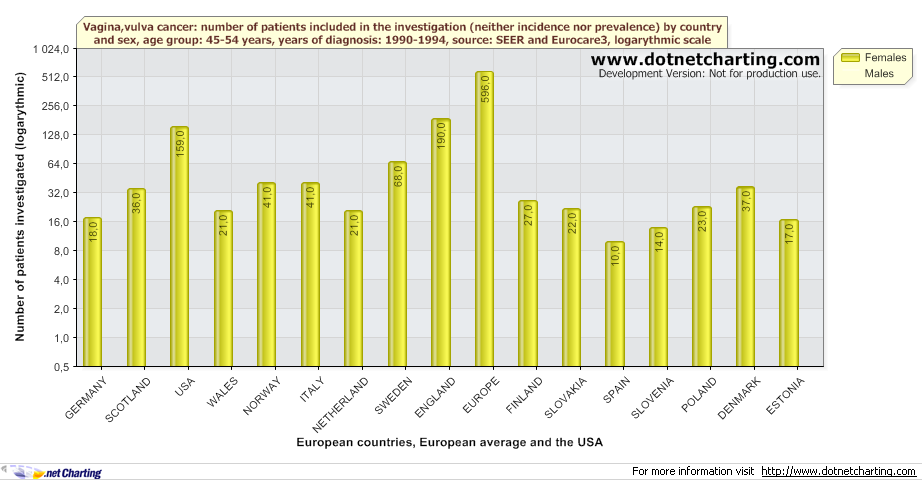
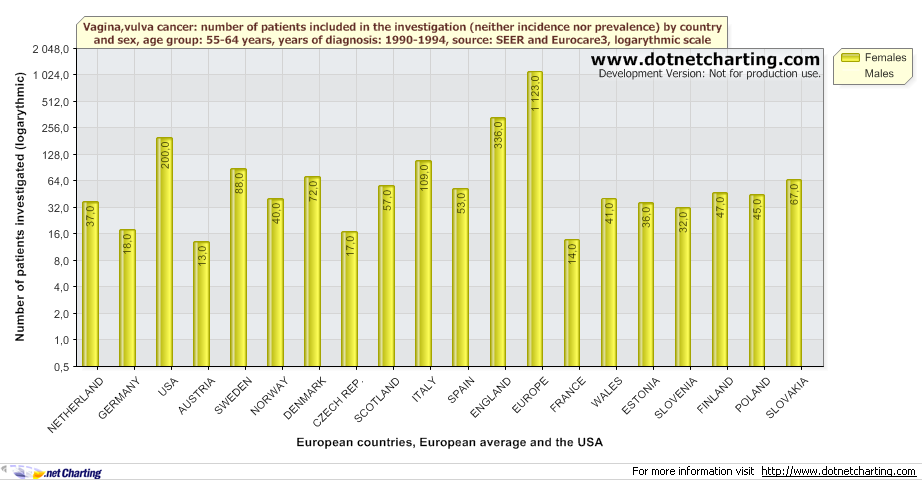
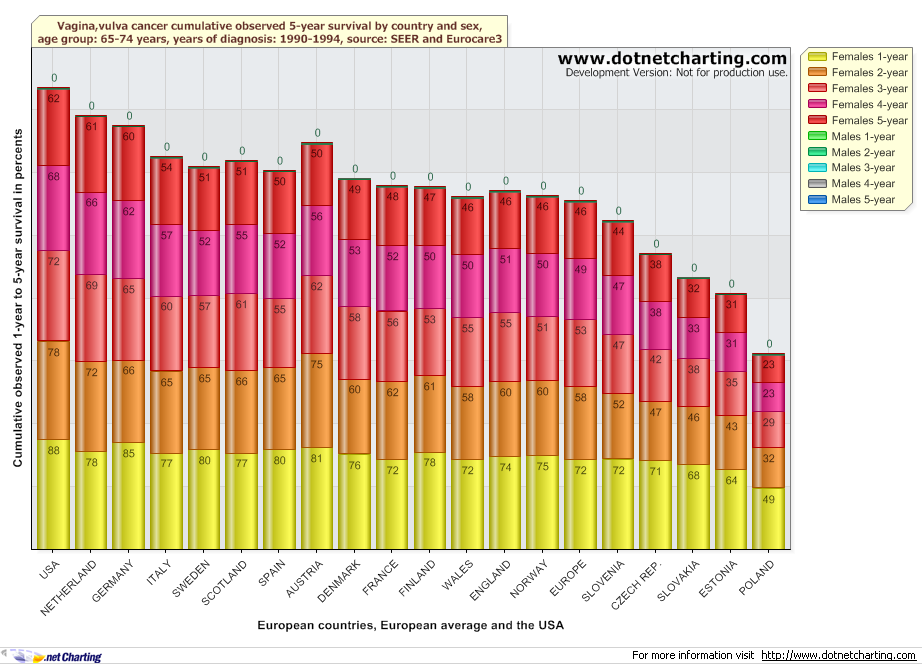
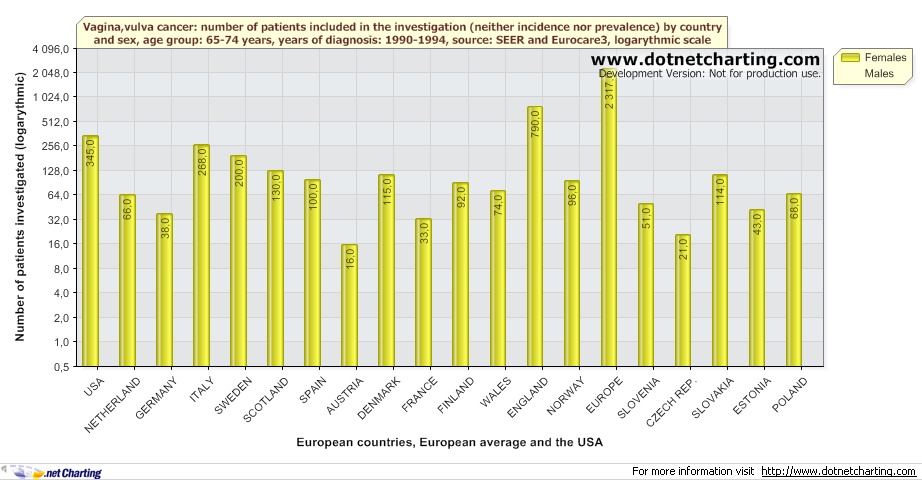
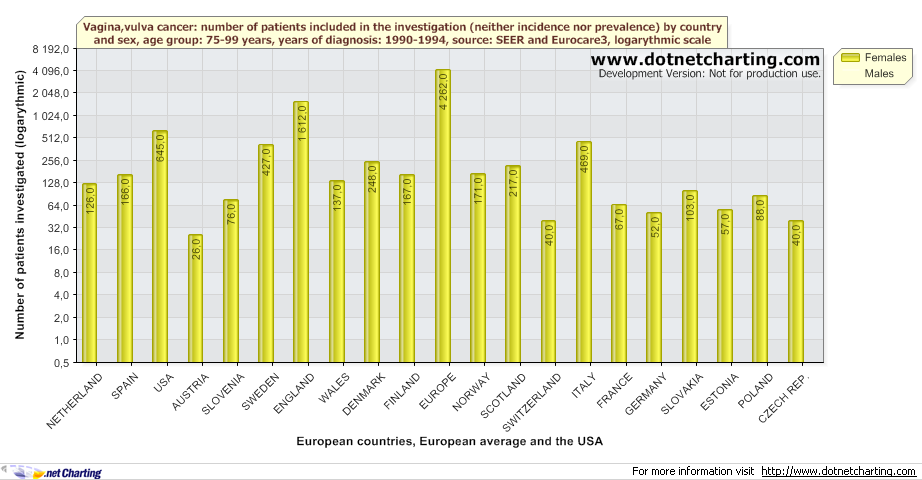
Vagina (vaginal) and vulva (vulvar) cancer - comparison of cumulative observed 5-year survival in Europe and the USA
Vagina (vaginal) and vulva (vulvar) cancer, age groups:
15-44 years
45-54 years
55-64 years
65-74 years
75-99 years
15-44 years
Back to the top of the page
45-54 years
Back to the top of the page
55-64 years

Back to the top of the page
65-74 years
Back to the top of the page
75-99 years
Back to the top of the page
15-44 years
45-54 years
55-64 years
65-74 years
75-99 years
15-44 years
Back to the top of the page
45-54 years
Back to the top of the page
55-64 years
Back to the top of the page
65-74 years
Back to the top of the page
75-99 years
Back to the top of the page


Subscribe to:
Posts (Atom)